Introduction
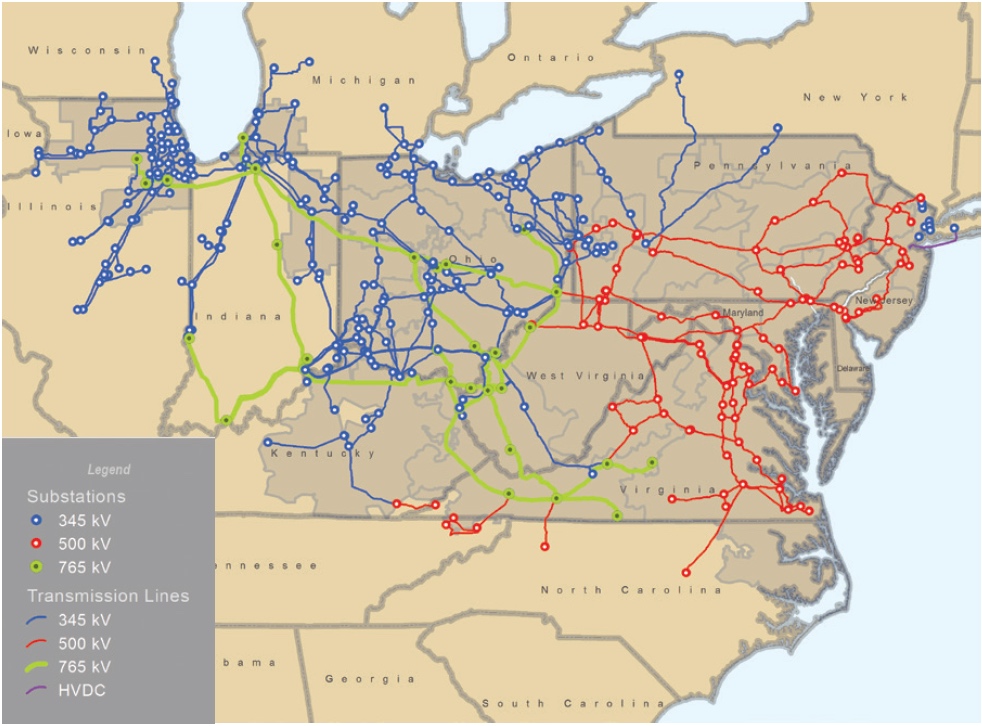
PJM Interconnection, which is the largest grid operator in America and serves more than 61 million people throughout 13 states and the District of Columbia, this week released its annual Regional Transmission Expansion Plan (RTEP). The RTEP is an important document because it charts the path for how PJM plans, over the next 15 years years, to dispatch more than 171,000 MW of generation capacity across 72,000 miles of transmission. To develop the RTEP, PJM annually conducts a thorough “stakeholder process” involving nearly 1,000 members, the Independent Market Monitor, and state public service commissions and other governmental and non-governmental organizations, all of whom gather with PJM’s planning department to consider how to implement a wide range of considerations such as:
- Load growth;
- Generating resource interconnection requests;
- Federal and state public policy (including regulatory action such as the Clean Power Plan);
- Fuel-of-choice shifts (i.e., from coal to natural gas);
- Renewable resources;
- Reliability criteria violations;
- Operational performance issues;
- Congestion constraints;
- Local reliability requirements;
- Distant load centers;
- Light load and winter peak load; and
- Aging infrastructure.
On the load side, PJM finds in the latest RTEP that flatter load growth means fewer network upgrades will be required. PJM attributes flat load growth to factors such as a slow recovery from the 2008 recession, increased efficiency in manufacturing and home appliances, and solar power.
On the generation side, PJM is experiencing a shift from coal to natural gas due primarily to inexpensive gas from the Marcellus Shale, but also as a result of coal plant deactivations driven by increasingly stringent environmental regulations. In addition to new gas resources, new wind and solar resources are being driven by favorable state and federal incentives, along with demand response and energy efficiency.
Today’s Resource Mix
PJM’s current installed capacity – nearly 172,000 MW of RPM-eligible “iron in the ground”– reflects a fuel mix comprised of 35 percent coal, 34 percent natural gas and 20 percent nuclear, as shown below. Hydro, wind, solar, oil and waste fuels comprise the remaining 11 percent.
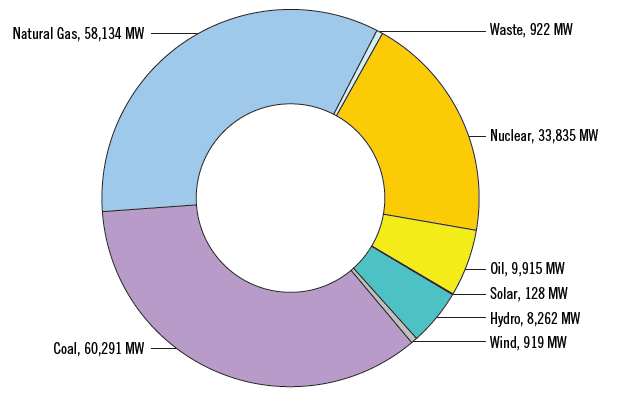
Today’s fuel-mix looks a lot different from 2010, particularly with regard to coal. In 2010, coal’s 66,221 MW accounted for 40 percent of capacity; today, coal’s 60,291 MW account for only 35 percent of capacity. The 2010 generation profile, which follows, illustrates the recent changes:
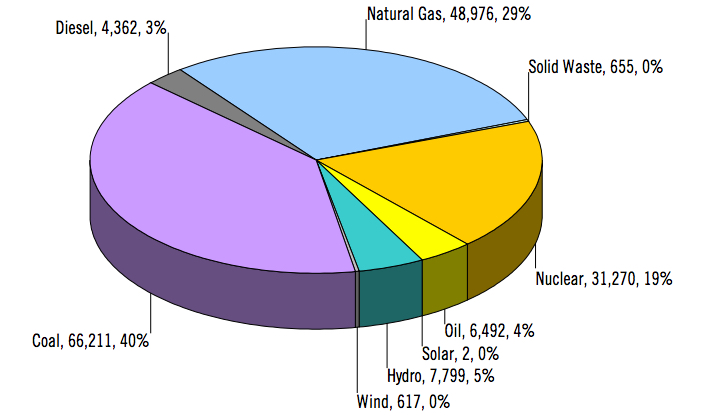
As discussed below, the 2015 RTEP shows that, with new projects in the pipeline overwhelmingly gas-fired, the trend away from coal appears certain to continue:
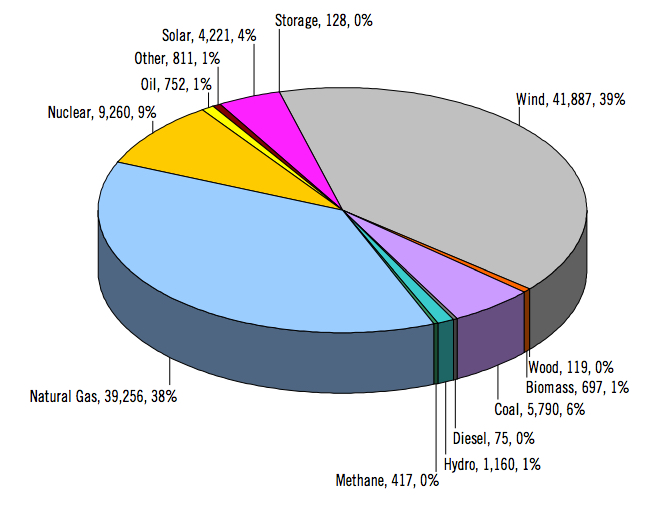
Resources Anticipated in Latest RTEP
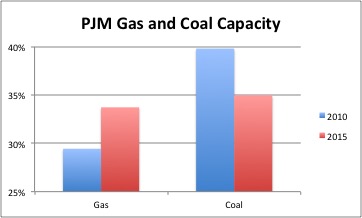
The generation mix reflected in the latest RTEP shows several dramatic shifts in installed capacity from only five years ago, most notably:
- Generators’ flight from coal (down 9 percent from 2010 to 2015)
- Big increase in natural gas (up 19 percent from 2010 to 2015)
- Big increases in wind (from 617 MW to 919 MW) and solar (2 MW to 128 MW)
But a truly momentous shift is reflected in the queue for new resources, with natural gas accounting for a whopping 87 percent of all queued capacity rights (72 percent when based on nameplate, with wind accounting for the bulk of the difference due to the large difference between wind’s nameplate and projected actual output):
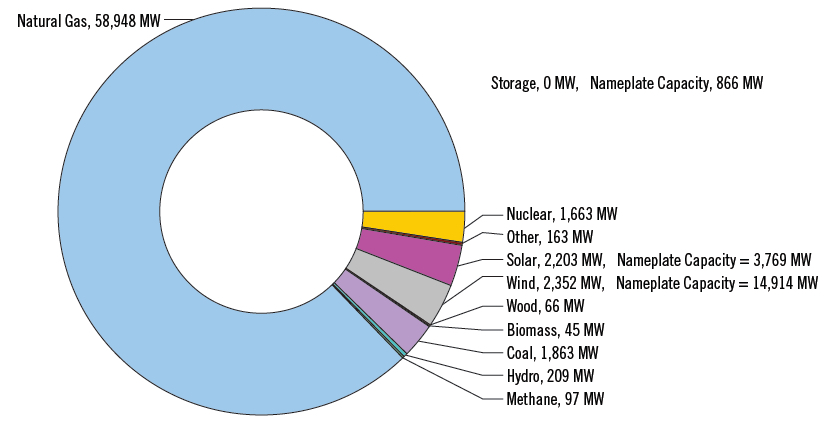
Big Shift in Fuel Choice
The 2015 queue stands in sharp contrast to the entire decade of applications from 1999 through 2010 not only in the lack of variety of fuels, but also in sheer magnitude. The queue in 2015 has nearly 60,000 MW of gas-fired capacity, while the 10-year cumulative applications from 1999 through 2010 for all fuel types contained a total of just over 100,000 MW, with just under 40,000 MW accounted for by gas.
Conclusion
With the extension in late 2015 of the Investment Tax Credit for wind and solar we should expect to see a sharp up-tick in those resources in the 2016 RTEP, but these will likely be in addition to, and not necessarily instead of, natural gas.
I invite you to view my other posts and sign up to receive future posts via email. I also invite you to follow me on LinkedIn and Twitter, and to contact me via my homepage.